
1.0 The 2026 Macro-Economic Landscape: The “Stay-Put” Renter Economy
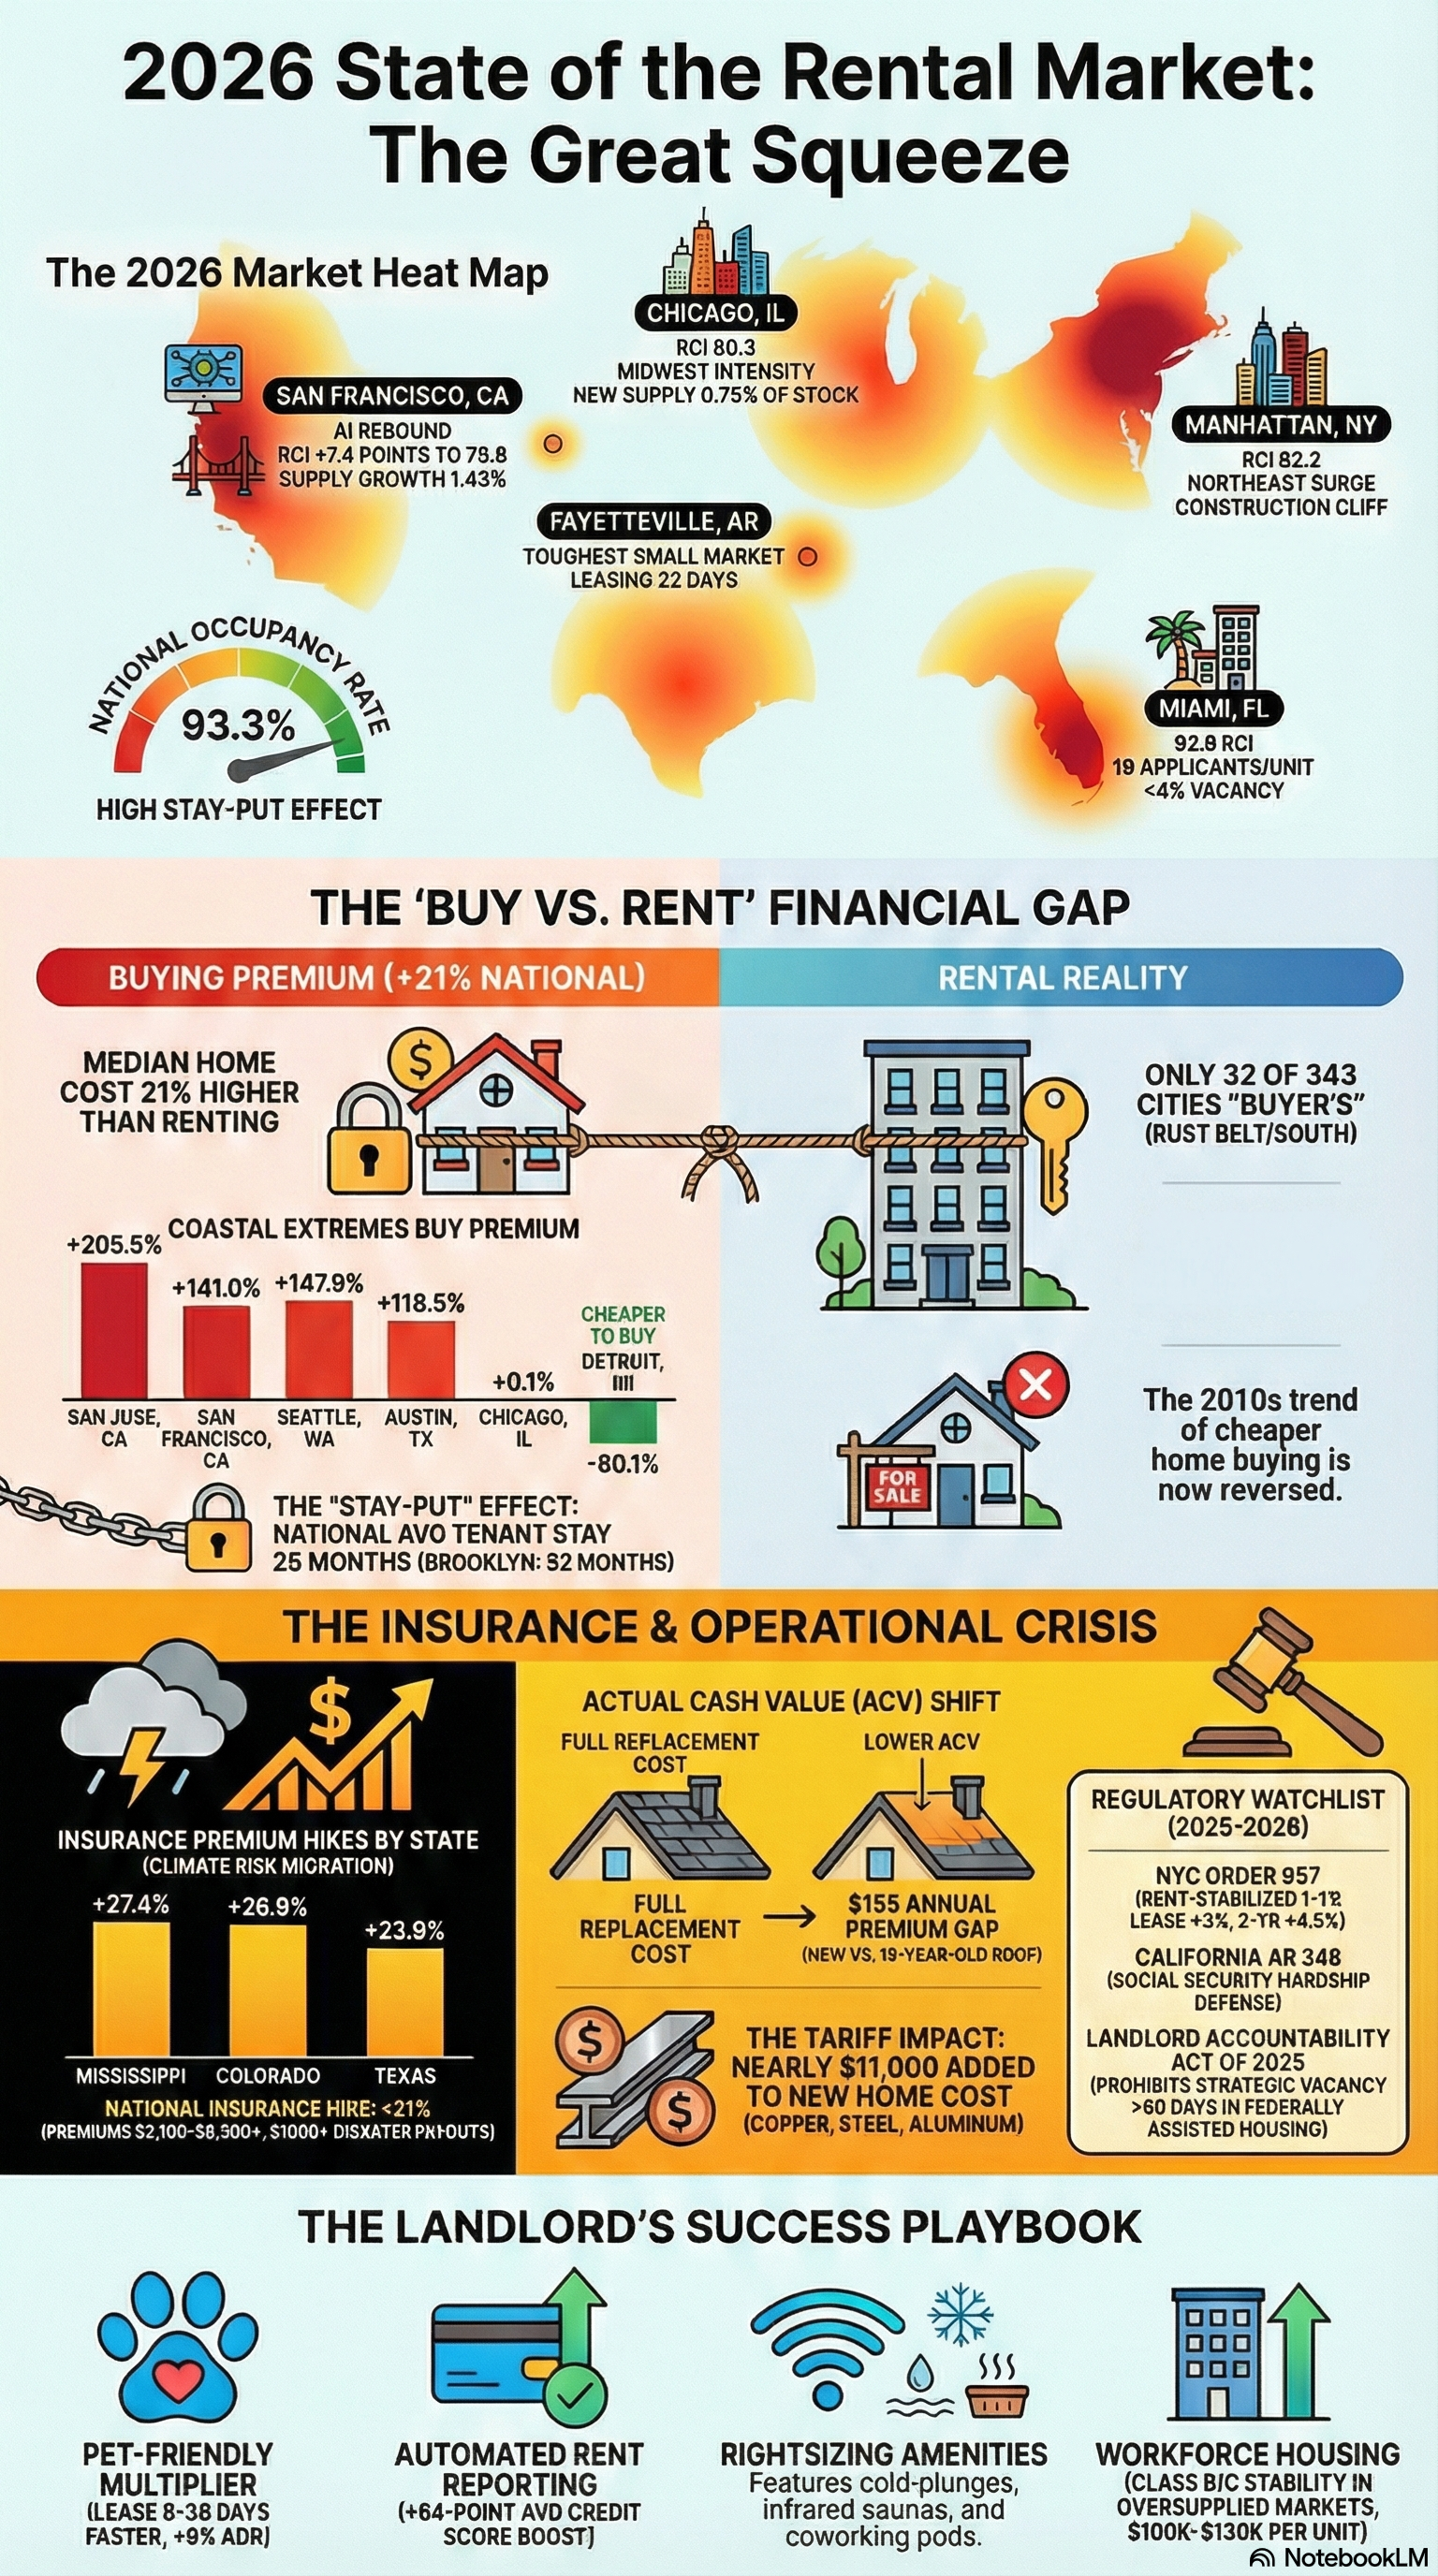
The defining characteristic of the 2026 U.S. rental market is a structural affordability chasm between renting and owning, which has created a captive and increasingly stationary tenant base, a “stay-put” economy that fundamentally reshapes investor strategy from growth-at-all-costs to a disciplined focus on resident retention and operational yield. High home prices and elevated living costs are compelling more households to remain in the rental market for longer, shifting the strategic focus for property owners from acquisition to long-term resident loyalty.
This dynamic is starkly illustrated by the national “buy vs. rent” calculation. As of January 2025, the typical monthly mortgage payment for a median-priced home is 21% higher than the typical monthly rent. For prospective first-time homeowners, the financial hurdle is even more severe, with an analysis indicating they face a staggering 105% monthly premium to buy versus rent.
This financial pressure directly translates into tenant behavior, favoring stability and discouraging moves. The national lease renewal rate has climbed to 63%, and the average length of tenancy has extended to 28 months. In highly competitive Northeast markets, tenant tenures now often exceed three years. This trend underscores a market where minimizing turnover and maximizing resident loyalty have become paramount to operational success.
National Renter Behavior Benchmarks (2025–2026)
Metric | Value |
|---|---|
Average Lease Renewal Rate | 63.0% |
Interested Renters per Vacant Unit | 9 |
Average Days to Lease | 41 Days |
National Occupancy Rate | 93.3% |
These national renter trends, however, are occurring within a complex and shifting supply environment, creating distinct challenges and opportunities across the country.
2.0 National Supply and Demand Dynamics
After a period of intense, pandemic-fueled construction, the U.S. rental market is navigating a “corrugated” recovery. This landscape is characterized by the coexistence of record-high vacancy rates in some metros with strong, persistent underlying demand nationwide. The market has shifted from a period of uniform growth to one of localized absorption, rebalancing, and price discovery.
A significant wave of apartment deliveries peaked in 2024, leading to a supply glut, particularly in high-growth Sun Belt markets. This oversupply is expected to take 18 to 24 months to be fully absorbed in the hardest-hit areas, causing the national vacancy rate to stabilize at an all-time high of 8.5%. While this figure suggests a tenant-friendly market, it masks deep regional variations.
Looking ahead to 2026, the new construction pipeline is tightening considerably due to elevated financing costs. A brief surge of newly completed apartments is forecast to boost national supply by 1.29% early in the year, but this growth is projected to slow dramatically to just 0.47% by year’s end. This slowdown indicates that ground-up financing will be limited, with available capital increasingly favoring acquisitions of existing assets over new development. This creates a strategic opening for well-capitalized investors to acquire stabilized assets from developers who may be facing refinancing pressure, often at a discount to replacement cost.
Despite the temporary supply glut, the durability of rental demand is not in question. Strong job growth, favorable demographics, and steady immigration are expected to provide a resilient foundation of demand that will help markets absorb the excess inventory over time.
These national supply and demand trends manifest differently across various regions, creating a clear geographic bifurcation in market competitiveness.
3.0 Regional Market Competitiveness: A Bifurcated Landscape
Strategic success in the 2026 rental market requires a nuanced understanding of regional dynamics. The U.S. rental market is not monolithic; a clear divide has emerged between “inventory-starved” markets, primarily in the Northeast and Midwest, and “high-supply” markets in the Sun Belt and West that are currently in a phase of correction and absorption. This bifurcation dictates everything from pricing power and vacancy rates to investment strategy.
Regional Rental Competitiveness Index (RCI) Score & Environment (2025–2026)
Region | RCI Score | Environment |
|---|---|---|
Northeast | 80.6 | Red-Hot |
Midwest | 80.3 | Red-Hot |
Florida | 79.5 | Highly Competitive |
South | 76.4 | Competitive |
Mid-Atlantic | 76.1 | Competitive |
Southeast | 72.8 | Moderating |
Southwest | 72.0 | Moderating |
Pacific Northwest | 70.6 | Balanced |
West | 69.3 | Tenant-Friendly |
3.1 The “Red-Hot” Northeast and Midwest
The high Rental Competitiveness Index (RCI) scores in the Northeast and Midwest are a direct result of a steep decline in new construction, robust and diverse job markets, and an established culture of long-term tenancy. These regions are characterized by intense competition for limited available units.
Chicago: Ranking as the second most competitive market in the nation, Chicago’s rental environment is defined by a construction cliff. New apartment completions have fallen to just 0.75% of the existing housing stock, pushing the occupancy rate to an impressive 95.1%. As a result, Chicago rentals lease faster than any other major metro, typically within just 32 days.
Manhattan: As the fourth-hottest U.S. market, Manhattan is experiencing intensified competition driven by the return of finance and real estate activity. A modest 0.84% increase in new units has been insufficient to meet demand, causing the number of applicants per vacant unit to jump from eight to 11 in the past year.
Suburban Twin Cities: This market saw the nation’s largest year-over-year gain in rental competitiveness. The primary driver was a sharp drop in new construction, with supply growth falling from 5.18% to just 2.45%, tightening available inventory and heightening competition among renters.
3.2 The “High-Supply” Sun Belt and Correcting Markets
While still desirable for their strong job growth and in-migration, many Sun Belt markets are navigating a challenging absorption phase. A massive wave of apartment completions has outpaced near-term demand, leading to rent corrections and the widespread use of concessions, such as one month of free rent, to attract tenants.
Austin: The Texas capital is experiencing the most severe rental market correction in the U.S. A massive oversupply of new units has led to year-over-year rent declines of 6–7%.
Texas Metros: Other major Texas markets are also seeing corrections, though less severe than Austin. Rents have decreased by 1–2% in Dallas-Fort Worth and approximately 4% in San Antonio.
Florida Metros: The Florida market is more varied. While Miami has seen roughly flat year-over-year rent changes and Jacksonville is flat to down 0.5–1.0%, other metros are correcting. Rents have declined by approximately 2% year-over-year (as of July 2025) in Orlando and approximately 1% year-over-year in Tampa. The Fort Myers/Cape Coral area has seen a more significant drop of 5–10%.
Beyond these regional dynamics, specific operational and property-level trends are now defining success for property managers and investors in 2026.
4.0 Emerging Operational and Property Trends for 2026
In this normalizing rent environment, the primary driver of Net Operating Income (NOI) growth has shifted from top-line rent hikes to bottom-line operational efficiencies and resident retention. This pivot is a non-negotiable strategic imperative for 2026. This shift is particularly acute in the high-supply Sun Belt markets, where a surplus of new units has intensified the competition for qualified residents, turning amenities and resident services into critical tools for absorption and retention.
Technology as an Operational Backbone
Operators are now competing on the quality of the resident experience, which is increasingly digital. With 74% of rental searches now occurring on phones, residents expect a frictionless, mobile-first journey. This includes seamless mobile access to their units, the ability to take self-guided tours on their own schedules, and the convenience of automated rent payments and maintenance requests. Technology is no longer a luxury amenity; it is an operational necessity for efficiency and resident satisfaction.
“Rightsizing” of Properties and Amenities
In response to rising construction costs, developers are building smaller average unit sizes. However, they are offsetting this reduced square footage with high-functionality features like superior closet systems, convertible workspaces, and built-in storage. The focus on amenities is also shifting from sprawling, underused spaces to purposeful, high-performing ones that extend a resident’s living space. In-demand amenities now include large-scale coworking lounges, sky lounges for socializing, and reservable chef’s kitchens. Furthermore, wellness has become a key differentiator, with properties adding features like infrared saunas and cold-plunge circuits to attract and retain health-conscious residents.
The Proven ROI of Pet-Friendly Policies
Adopting a pet-friendly policy has become one of the most effective strategies for reducing vacancy and increasing revenue. The data is compelling:
58% of renters now own pets, a significant and growing demographic.
Pet-friendly rentals lease an average of 8 days faster than non-pet units.
Online, pet-friendly listings receive 9% more views and 12% more saves.
Pet owners tend to stay 30% longer in a rental property, reducing costly turnover.
The “Triple Win” Credit-Building Strategy
An innovative and impactful retention strategy is the adoption of automated rent reporting to credit bureaus. This “Triple Win” approach benefits residents, property managers, and the property’s financial performance. Research shows 85% of residents are more likely to pay rent on time if they know it is being reported, directly improving cash flow. This service provides a tangible benefit to residents, helping them build credit and achieve financial mobility, which in turn fosters significant loyalty and reduces churn.
While these trends present clear opportunities, investors and operators must also navigate significant operational and regulatory headwinds.
5.0 Key Headwinds: The Insurance Crisis and Legislative Horizon
Two primary challenges are creating significant operational and financial risks for rental property owners in 2026: a systemic crisis in the property insurance market and an evolving landlord-tenant legislative landscape. Together, these headwinds represent a significant compression of profit margins, demanding a more sophisticated approach to risk management, underwriting, and budgeting than was required in previous cycles.
5.1 The Property Insurance Affordability and Availability Crisis
The property insurance market is in a state of turmoil, driven primarily by the escalating frequency and severity of climate-related events. Severe convective storms, wildfires, and flooding are no longer isolated risks but systemic drivers of rising premiums and reduced policy availability. Compounding this issue, tariffs on key construction materials like copper and steel are expected to further increase the cost of building repairs, which will directly translate into higher insurance premiums.
Top 5 States by Home Insurance Premium Increases (2025)
State | Premium Increase |
|---|---|
Mississippi | +27.4% |
Colorado | +26.9% |
Texas | +22.0% |
Georgia | +19.4% |
New York | +19.2% |
In response to rising claims, insurers are implementing stricter underwriting guidelines to mitigate their risk. Carriers are placing a greater emphasis on roof age, with the premium gap between a new roof and a 15-year-old roof widening to $155 annually. In high-risk states like California, Florida, and Texas, where traditional carriers have pulled back, the Excess and Surplus (E&S) insurance market has grown to fill coverage gaps, though often at a significantly higher cost to property owners. For investors, this crisis necessitates underwriting significantly higher annual growth for insurance expenses potentially 15–25% in high-risk states and prioritizing capital expenditures on resilient features, such as new roofs and impact windows, to mitigate future premium hikes.
5.2 The Evolving Legislative Landscape
The regulatory environment for landlords continues to evolve, with new laws aiming to increase tenant protections and landlord accountability. A prime example is California, where several new laws took effect on January 1, 2026, impacting day-to-day operations.
AB 246 (Social Security Tenant Protection Act): Authorizes tenants to assert Social Security hardship as an affirmative defense in unlawful detainer proceedings for nonpayment of rent.
AB 628 (Habitability: Stoves and Refrigerators): Classifies a dwelling that lacks a working stove or refrigerator as legally untenantable.
AB 414 (Security Deposits): Clarifies that the itemized statement of deductions can be provided via email upon mutual agreement and allows for written agreements on alternative methods for refunding the deposit itself.
AB 1414 (Internet Service): Requires landlords to allow tenants to opt out of paying for any third-party internet service subscription bundled with the tenancy.
Beyond state-level changes, localized regulations remain a critical factor. For example, the New York City Rent Guidelines Board’s Order #57 sets specific rent adjustment levels for leases commencing between October 1, 2025, and September 30, 2026, directly impacting revenue potential for rent-stabilized units.
A successful 2026 strategy will require the careful integration of these market dynamics, operational trends, and risk factors.
6.0 Conclusion: Strategic Outlook for 2026
The 2026 U.S. rental market is defined by a crucial pivot from the speculative, high-growth environment of recent years to a new chapter centered on operational efficiency, resident satisfaction, and proactive risk management. The operators who thrive will be those who recognize that with cooling rent growth, the primary drivers of profitability are now retention, speed, and strategic investment in the resident experience. For investors and property managers, success in the year ahead will depend on mastering four key strategic pillars:
Prioritize Renter Retention. The “stay-put” economy, driven by the high cost of homeownership, has made the existing resident base more valuable than ever. High national lease renewal rates underscore this trend. Focusing on strategies that build resident loyalty such as automated credit reporting, thoughtful pet-friendly policies, and responsive service is critical to minimizing costly turnover and maintaining stable cash flow.
Execute a Bifurcated Investment Strategy. The national market is clearly divided. Investors should capitalize on this by targeting “inventory-starved” Northeast and Midwest markets for stable, long-term holds where demand consistently outstrips supply. In contrast, exercise caution in “high-supply” Sun Belt metros, where the focus should be on value-add opportunities in Class B/C workforce housing rather than competing in the overbuilt luxury sector.
Weaponize Operations as a Competitive Advantage. In a market where aggressive rent hikes are no longer feasible, the competitive edge lies in speed, convenience, and clarity. Investing in technology that creates a frictionless experience for touring, leasing, communication, and maintenance is no longer optional. The operators who make their properties the easiest to live in will win the market.
Proactively Manage Risk. The escalating insurance crisis and the evolving regulatory landscape are now core components of asset management. Proactively budget for rising insurance costs, invest in climate-resilient property features to mitigate future premium hikes, and stay rigorously informed on local landlord-tenant laws. Protecting cash flow and ensuring compliance are essential to navigating the headwinds of 2026.
Ultimately, the operators who successfully adapt to these trends by prioritizing efficiency, resilience, and the resident experience will be best positioned for durable success in the coming year and beyond.
Test Your Knowledge! 🎯
Question 1 of 5


